

Under the Individuals with Disabilities Education Act (IDEA), students with disabilities have the right to be educated in the least restrictive environment (LRE) — alongside their non-disabled peers to the greatest extent appropriate. Every state reports on this through federal Indicator 5a: the percentage of students with IEPs who spend 80% or more of their school day in a regular education classroom. It is the primary measure of inclusive education, and it is more than a compliance number. Decades of research link inclusive placement to stronger academic and social outcomes for students with disabilities.
So, we asked a straightforward question: How do Goalbook partners — specifically, districts that have used Goalbook Toolkit for four or more years — compare to their state averages on this metric?
What We Looked At
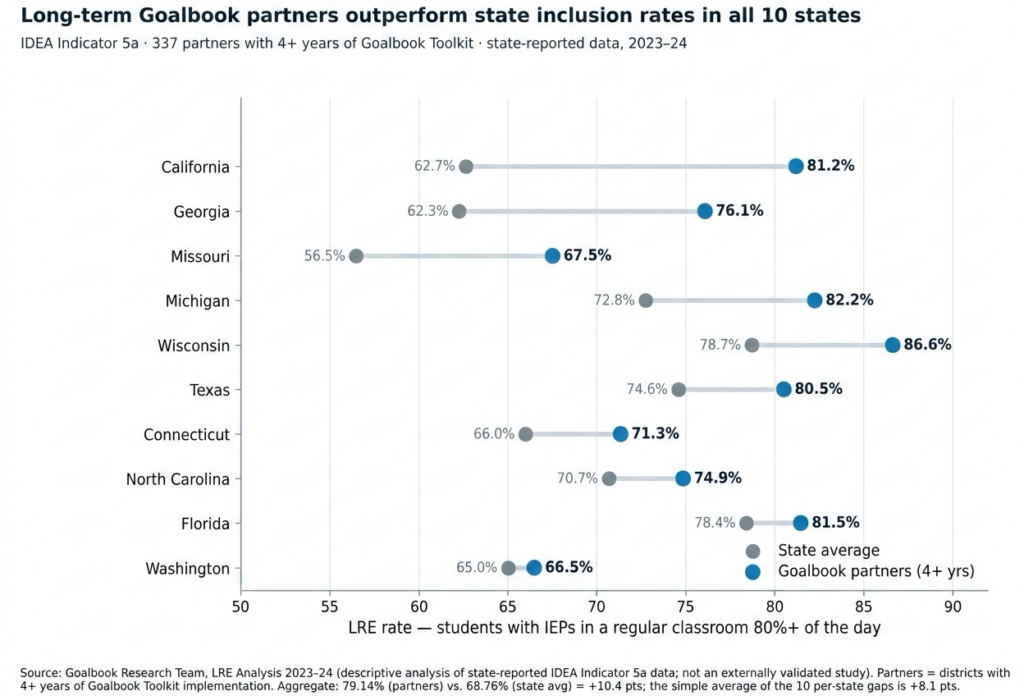
Using the most recent state-reported data available (the 2023–24 school year), the Goalbook Research Team analyzed Indicator 5a across ten states: California, Connecticut, Florida, Georgia, Michigan, Missouri, North Carolina, Texas, Washington, and Wisconsin. Within those states, we identified 337 Goalbook partner districts with 4+ years of implementation and compared their average LRE rate to the general state average.
We focused on long-term partners deliberately. If a tool has a real effect on how a district serves students, that effect should show up in districts that have had time to embed it into practice — not as a one-year blip, but as sustained infrastructure.
What We Found
The pattern was consistent and pointed in one direction.
In all 10 states we analyzed, long-term Goalbook partners posted higher inclusion rates than their state’s average — by 8.1 percentage points on average.
Some states stood out:
- California: Goalbook partners reached 81.2% inclusion versus the state average of 62.7% — an 18.5-point advantage.
- Georgia: Goalbook partners 76.1% versus 62.3% state average — a 13.8-point gap.
- Missouri: Goalbook partners 67.5% versus 56.5% state average, clearing the state’s own target of 58%.
- Michigan: Goalbook partners 82.2% versus 72.8% state average.
- Wisconsin: Goalbook partners 86.6% versus 78.7% state average.
Why This Matters
Two things make this snapshot worth sitting with.
First, consistency. Inclusion rates are shaped by many forces — state policy, funding, demographics, local culture. It would be unremarkable for a group of districts to beat the average in a few states by chance. Beating it in all ten, by an average of eight points, is a harder pattern to dismiss. It suggests something systematic about how these districts approach the work.
Second, duration. This analysis deliberately looked at partners with four or more years of Goalbook Toolkit implementation. That framing matters because it points to Goalbook Toolkit functioning not as a quick fix, but as long-term instructional infrastructure — the kind of shared language, resources, and practice that helps a district move students into more inclusive settings and keep them there. Inclusion isn’t a switch you flip; it’s a capacity you build. These are districts that have had time to build it.
Inclusion succeeds when educators can design instruction that gives every student access to grade-level content in the general education classroom — the heart of what Goalbook Toolkit is built to support through standards-aligned goals, Universal Design for Learning strategies, and scaffolded instruction. Higher LRE isn’t just a placement decision; it’s downstream of whether teachers feel equipped to serve students with disabilities in the general education setting.
One district makes the human version of this concrete. Hortonville Area School District (WI) moved from 48% to 88% LRE and eliminated all self-contained emotional/behavioral-disorder classrooms — a transformation of what inclusion looks like for its students, not just a number on a report.
What This Is and Isn’t
We want to be precise about what this analysis can and cannot say. It is descriptive. It compares real, state-reported outcomes for a defined set of long-term Goalbook partners against state averages, and it finds a clear, consistent advantage. It does not prove that Goalbook caused that advantage; districts that invest in Goalbook for four-plus years may differ in other ways that also support inclusion.
But descriptive doesn’t mean unimportant. When districts that have committed to Goalbook Toolkit implementation for years consistently serve more of their students in inclusive settings than their peers statewide — in every state we examined — that is a signal worth paying attention to. For leaders working to raise district LRE rates, it offers both a benchmark and a direction: inclusion at scale is achievable, and the districts getting there are the ones building durable instructional capacity to support it.
Source: Goalbook Research Team, “LRE Analysis 2023–24: Goalbook Partners & State Averages.” A descriptive analysis of publicly reported IDEA Indicator 5a data for the 2023–24 school year across 10 states; 337 Goalbook partner districts with 4+ years of implementation. This is an internal analysis, not an externally validated research study, and does not establish causation.
